nostalgeo wins the audience award at Apps For Europe
After winning AppsforGeo and AppsforFlanders, nazka's nostalgeo also won the audience prize at Apps for Europe.
read more
12 february 2025
Web designers are not cartographers: cartography is all about data visualization and comes with its own complex rulesets. That is why it is often good practice to fall back on proven map designs and to keep changes to the map style to a minimum. Not all maps need to be extremely accurate for their intended purposes though. Sometimes we get the opportunity to be a bit more creative.
When we are working on a project that allows for some creativity, it is definitely valuable to collaborate with an external designer. Although an external graphic designer may not always have a lot of experience with online maps, they are not hindered by the typical map layout as a starting point for the design. As an outsider, the designer can help us to bring out the essence and create a map that is very effective and at the same time quite unique.
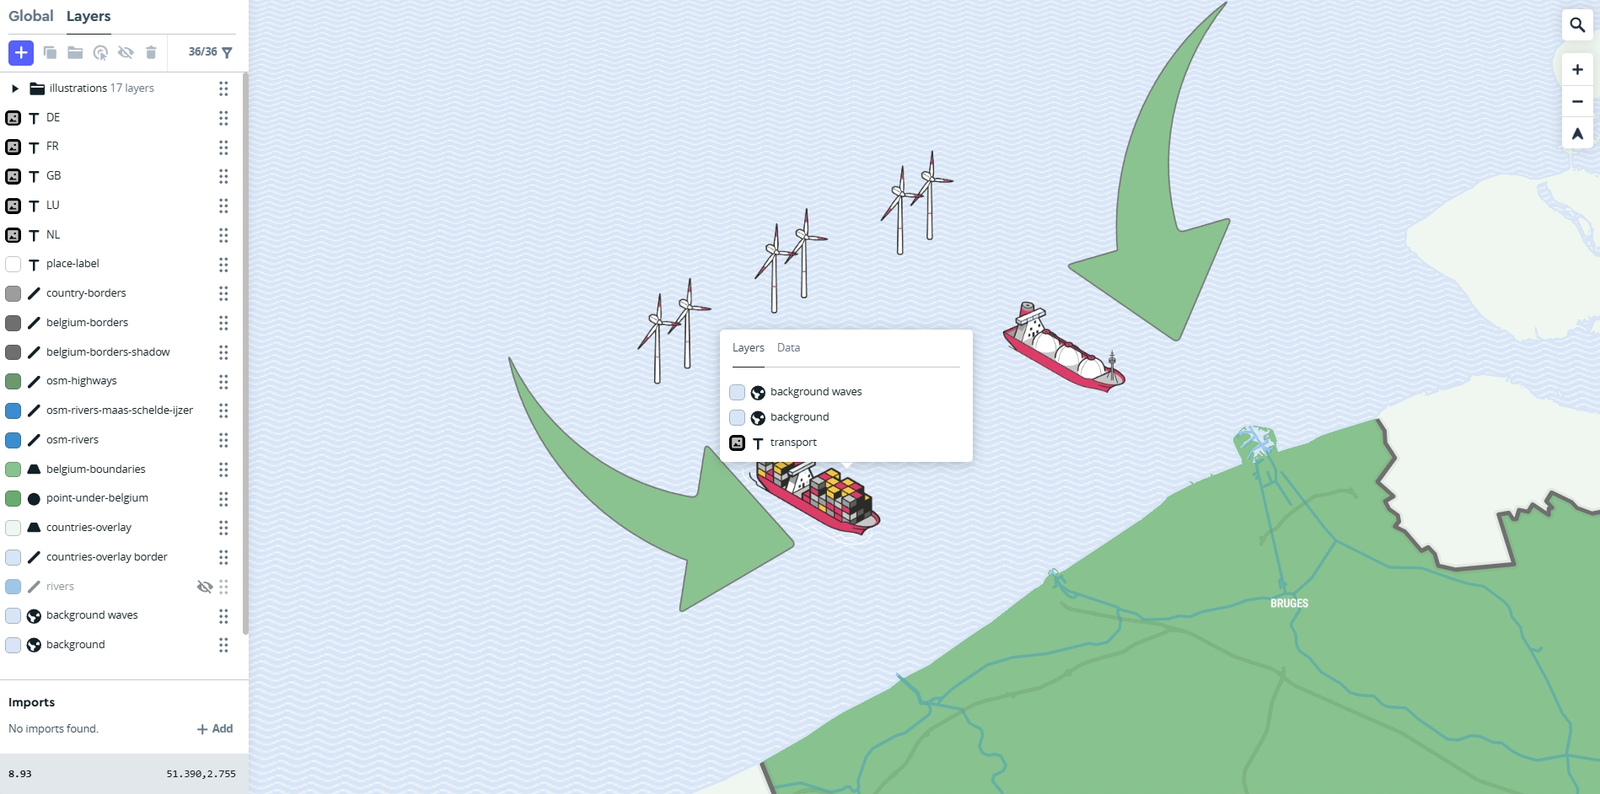
The map on hydrogen activities is a good example: it is a nice blend between aesthetics and functionality. Its style is something you might expect in a book but not necessarily on the web: the wavy sea, arrows, wind turbines and other illustrations are all unique design features that require equally unique solutions to turn into something digital.
Here we can take advantage of tools like Mapbox Studio or MapTiler Cloud. These tools allow users to modify colours, typography, layers, and data visualization to create specialized maps in a user-friendly way. At times creativity will still be needed but these tools definitely speed things up.

The hydrogen map is a beautiful example that cartography and creativity don't have to be mutually exclusive. By combining the right tools and a bit of daring, you can create maps that are not only informative but also visually appealing!


